Demeter 2.0
What is  ?
?
Demeter is a telemetry system for the acquisition, presentation and analysis of measurement data in industrial and business environments. Its main purpose is to be able to combine and analyse measurements from the most diverse fields. In addition, Demeter enables data processing and conversion. Analytical algorithms used in Demeter can form the basis of presentations and reports displayed in Demeter applications.
Media-specific systems focusing on in-depth analysis of the physical parameters of a process or accounting for the consumption of energy resources are too weak a weapon against the realities of today's market, which is why Demeter was developed.
How is Demeter superior to other systems?
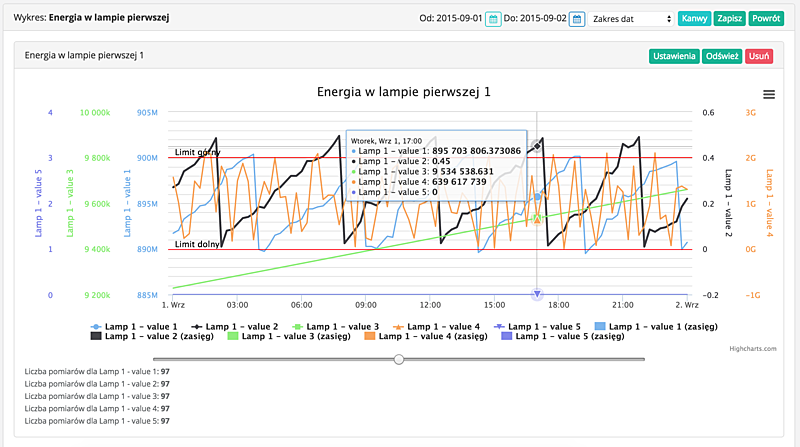
![]() Online data presentation
Online data presentation
Our system is designed so that the user can access it via any device with a web browser. Both statements and reports generated by the system, as well as synoptic presentations - network diagrams, visualisations of industrial processes, indicators of exceedances – are programmed in the form of dynamic web pages created on the basis of HTML5 technology. The user is provided with a portal where he/she can view the latest and archived reports and information on the system infrastructure.
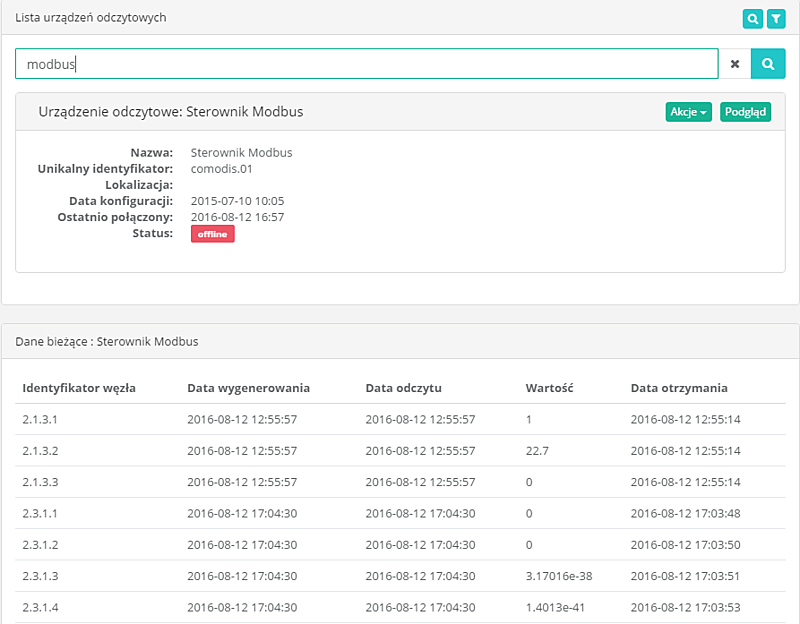
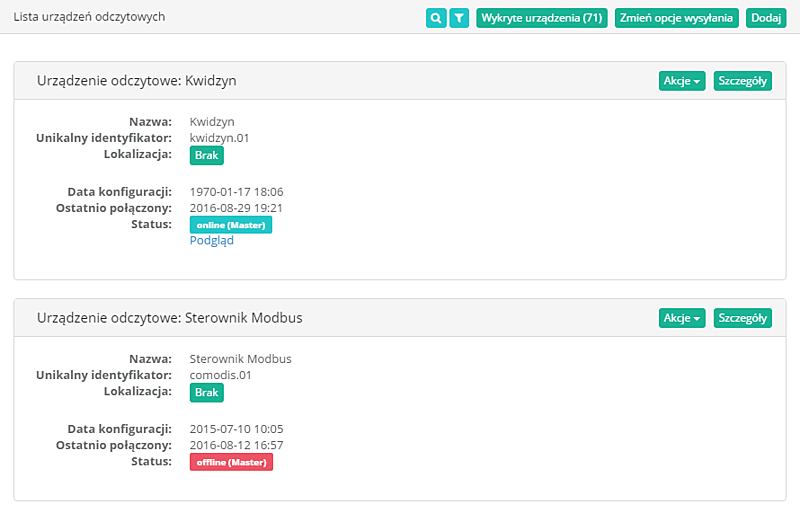
![]() Autonomous monitoring, alarming and control
Autonomous monitoring, alarming and control
The principle of the Demeter system is to decentralise measurement and control functions. Maximum emphasis is placed on the operation of controllers and data concentrators. This ensures that most of the vital functions of the system remain undisturbed during a failure of the user' s computer or even the system server. This applies, for example, to data acquisition, excess warning or load control.
When constructing the network, we use only devices of renowned manufacturers which, apart from reliability, also offer software allowing to incorporate visualisation of operation of individual devices in the structure of a web page constituting a user interface.
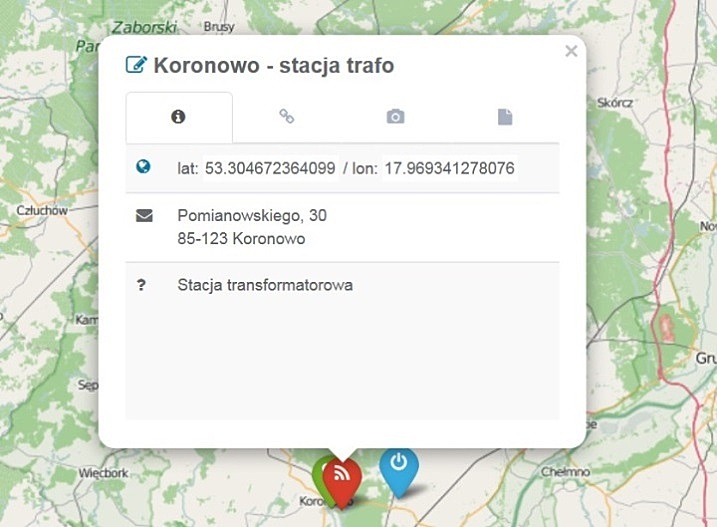
![]() Maps
Maps
Module using OpenStreetMaps. We can mark the location of a reading point in any place of our choice for the internal needs of the system, which in the long run is very useful, e.g. in case of failure of a given point.
![]() Synoptic maps
Synoptic maps
The analytical maps function allows for uploading a graphic file of any format to the system and using it as a map for measurement points - similarly to the ‘Maps’ option.
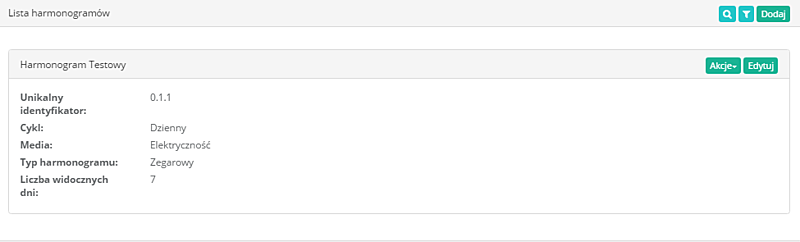
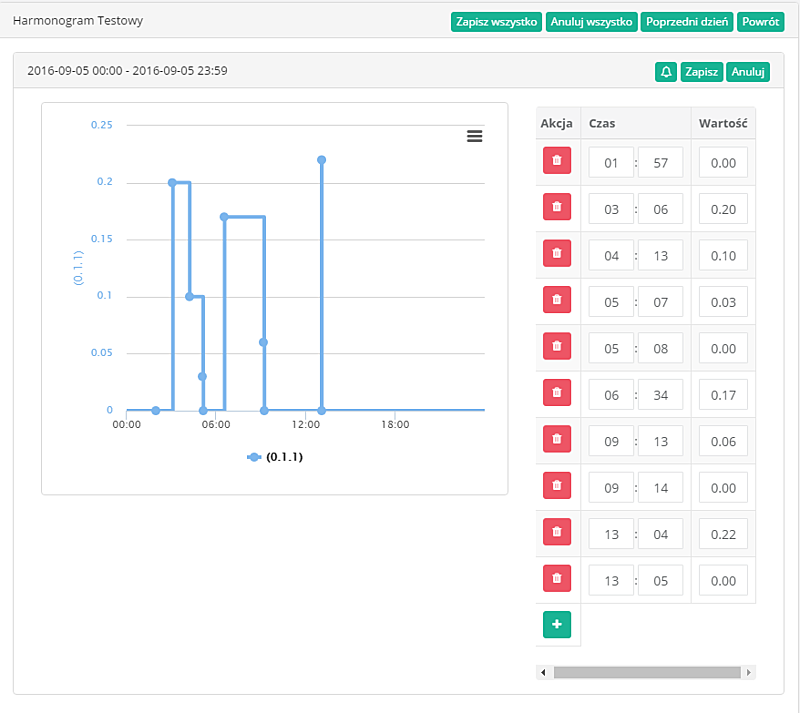
![]() Schedules
Schedules
This function implements the control of measuring points. With the push of a button, we are now able to change e.g. the light intensity of a lamp. Multiple objects can be controlled simultaneously.